The Algorithm Fact You Explain on Every Call, Never Once a Graphic
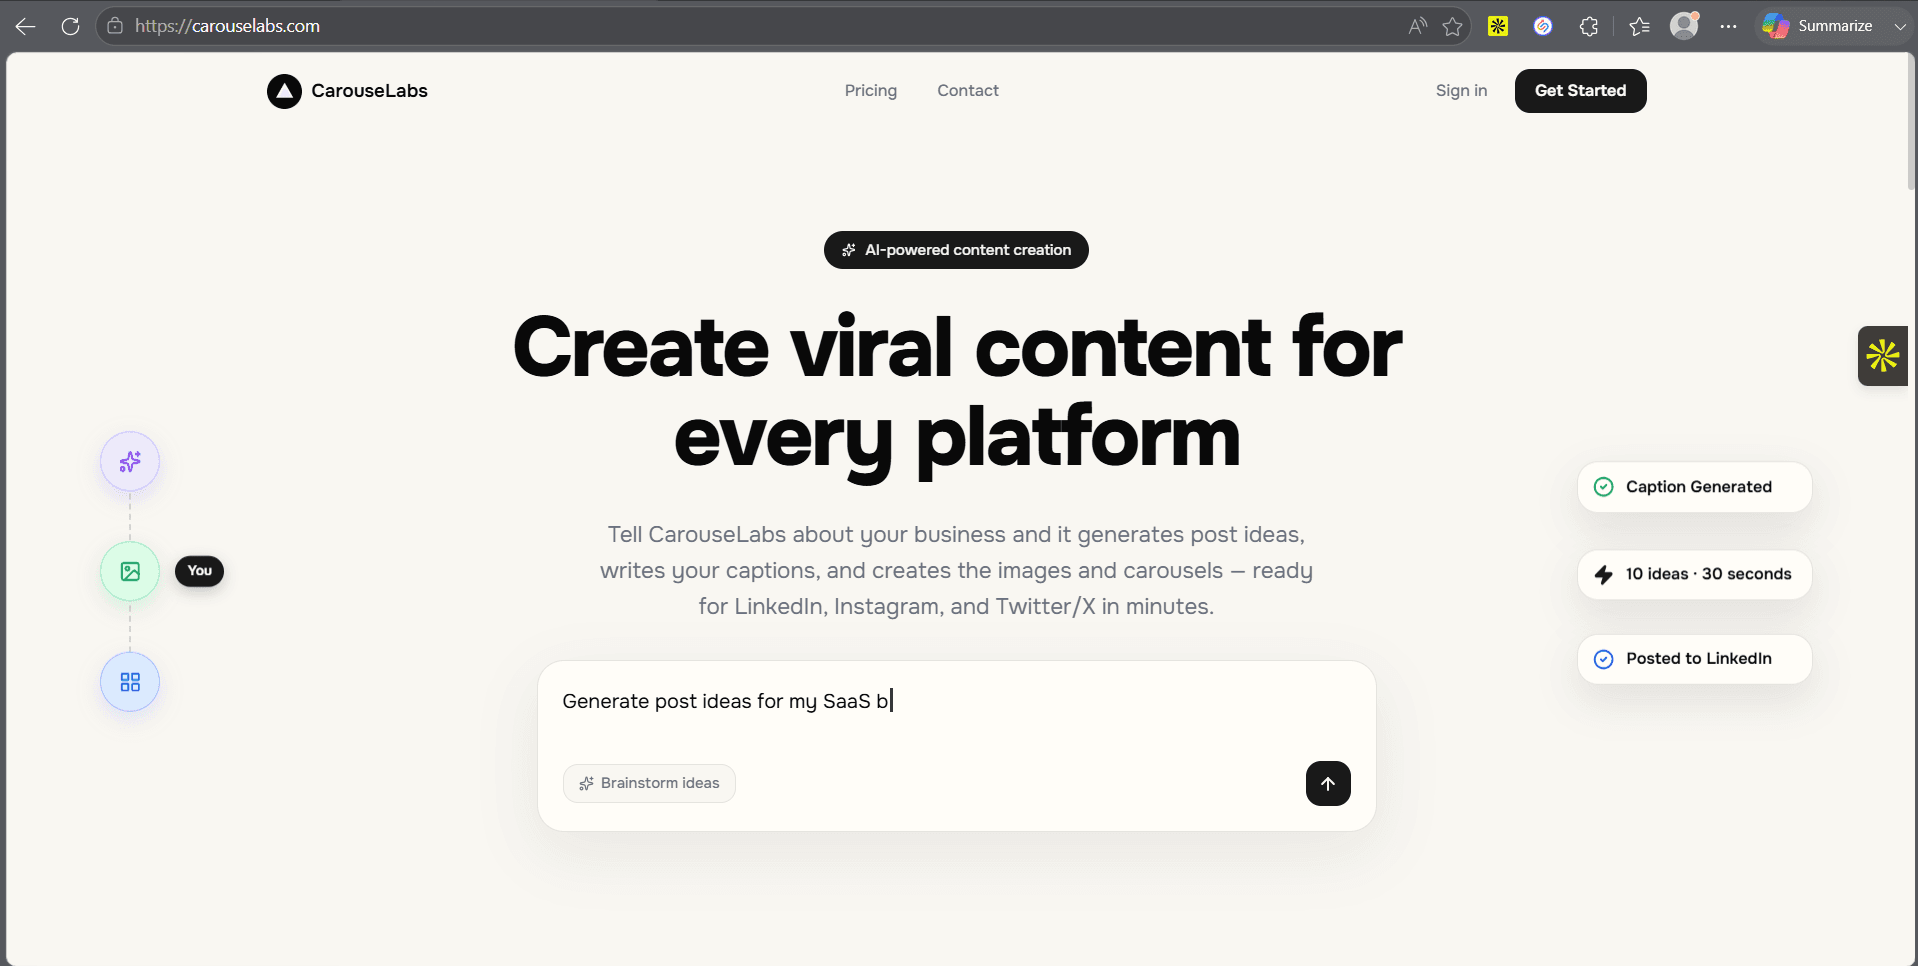
You explain the same algorithm fact to clients on calls constantly — reach isn't just about frequency, engagement in the first hour matters more than total likes — and it's never existed as the kind of clean, shareable graphic that would actually spread the idea further. CarouseLabs turns one thing you explain often into a single clear graphic.
Before vs. After
The same algorithm fact gets explained verbally on calls constantly and never exists as a shareable graphic
5 minutes — that fact becomes a single clear graphic
How It Happens in 5 Minutes
- 1 min
State the fact or insight in a sentence
- 3 min
CarouseLabs designs a clean graphic around it
- 1 min
Post it as a standalone visual
A Real Example
An SMM types: 'Fact: engagement in the first hour matters more than total likes for reach.' CarouseLabs returns an image with that line as the headline and a simple supporting visual element (a small clock icon or timeline graphic) reinforcing the 'first hour' idea.
Frequently Asked Questions
How do I keep this from looking too text-heavy?
State the core insight in one short sentence — CarouseLabs designs the layout to stay clean rather than crowded.
Can this include a simple chart or graph?
Yes, if the fact involves a comparison or trend, a simple supporting visual can be included alongside the text.
Will this work for platform-specific facts, like Instagram vs. LinkedIn?
Yes, specify the platform and the fact and framing adjust accordingly.
How is this different from the reactive-take hook tool?
That tool builds a hook line for a timely reactive post; this creates an evergreen standalone graphic around a fact, not tied to breaking news.
Keep Going
Stop Planning to Post. Post.
Every minute spent deciding whether to write it is a minute you could've spent already publishing it. CarouseLabs closes that gap.
Get started freeNo credit card required